MLS Statistical Analysis makes its return for the 2012 season. If you haven’t read it before, it’s a look inside the numbers to try to link a team’s statistical performance with its success (or lack thereof.) As usual, the first graphic is the data I used to put together the stats. It’s organized alphabetically.
(GP = games played / G = goals / S = shots / SOG = shots on goal / FC = fouls committed / FS = fouls suffered)
A few numbers jump off of the page right away.
1) Sporting Kansas City’s the only team to shoot more than 100 times (105) thus far in the season. Montreal is the next closest (98), but they’ve played one more match.
2) Only three teams, New York (16), Real Salt Lake (11), and San Jose (10), have scored double digit goals.
3) In seven games, Montreal has committed far and away the most fouls in the league, with 112. No MLS team has committed more than 87.
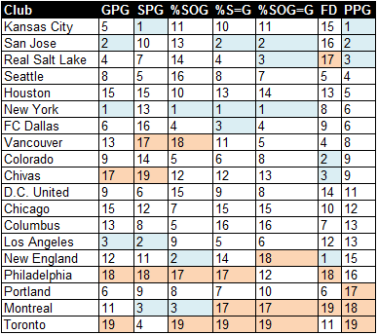
From this data, we got the following statistics, organized by PPG (Points Per Game):
(GPG = goals per game / SPG = shots per game / %SOG = percentage of shots that are on goal / %S=G = percentage of shots resulting in goals / %SOG=G = percentage of shots on goal resulting in goals / FD = foul differential, fouls suffered minus fouls committed)
Kansas City have a 100% record, with 6 wins from 6 matches. Toronto are at the absolute other end of the spectrum, with zero points from five matches. Four teams are averaging 2.00 points per game (Kansas City, San Jose, Real Salt Lake, Seattle), and five are averaging 1.0 or less (New England, Philadelphia, Portland, Montreal, Toronto.)
Kansas City’s shooting a blistering 17.50 times per game, which is 3.10 more times per game than 2nd place Los Angeles, but those shots aren’t going in very often (8.57%), which is something that is analyzed further in the rankings, sorted by PPG, with the top 3 of each category in blue and the bottom 3 in orange…
Kansas City’s leading the league in PPG and SPG, but isn’t doing too great in the other categories. Usually that points to defensive dominance, which we’ll delve into later this week. All of those shots are on frame 35.24% of the time (11th), and going in the goal at a rate that places them 10th in the league.
Red Bull New York are performing extremely well in most offensive categories. They’re not shooting a lot (10.83 SPG, 13th), but they’re scoring 2.67 goals per game, finding the frame 49.23% of the time, scoring on 24.62% of their shots, and 50% of their shots on goal are goals, all good for 1st in the league. With all of this offensive consistency, you’d think they’d be doing better than a PPG rate of 6th (1.67 PPG), so I have a feeling that their defense will show poorly.
Toronto is dead last in all shooting related statistics except for SPG (13.60, 4th); They’re scoring 0.40 GPG, finding the frame 25% of the time, scoring on 2.94% of their shots, and scoring on 11.76% of their shots on goal.
Montreal are shooting a lot (14 SPG, 3rd) and finding the frame consistently (39.8%, 3rd), but they’re not scoring when they shoot overall (6.12%, 17th), or when it’s on frame (15.38%, 17th).
D.C. United are not performing particularly well or particularly poorly in any category. At best, they’re 6th in SPG (OH MY GOD, they’re SHOOTING!) with 13 shots per game. At worst, they’re 15th in percentage of shots on goal (32.05%). The rest of the shooting rankings are in the 9-11 range. I’ll be interested to see how the defensive and goalkeeping statistics end up looking. We’ll get to those later this week, for DCU and the rest of the league.
Filed under: DC United, Statistical Analysis | Tagged: MLS | Leave a comment »


